Build a wind generation forecast dashboard in Python
Hourly wind output, capacity factor and a chart, in about 40 lines of Python.

A wind farm's output has nothing to do with the clock and everything to do with the weather. Unlike solar, which follows a predictable daily curve, wind generation can spike at 2am and drop to almost nothing at noon. That makes forecasting harder, and more valuable, for anyone planning grid bids, storage, or maintenance windows.
This tutorial builds a small dashboard around Meteosource's wind power prediction API, using Python and Streamlit. By the end, you'll have a working local app that turns a farm's specs and a location into an hourly generation forecast.
What you'll need
Python 3.10 or later
A Meteosource account on the Renewables tier (wind and solar prediction aren't part of the free plan, but there's a free 10 day trial)
Ten minutes
Create a virtual environment and install the libraries:
python3 -m venv venv            # Windows: python -m venv venv
source venv/bin/activate        # Windows: venv\Scripts\activate
pip install streamlit pandas requests
Step 1: Understand the data
The wind prediction endpoint takes your farm's specs (turbine count, hub height, total capacity) along with a location, and returns hourly production. A simplified response looks like this:
{
  "hourly": {
    "data": [
      {
        "date": "2026-06-07T00:00:00",
        "production": 3026206.75,
        "wind_10m": {
          "speed": 6.9,
          "gusts": 13.3,
          "angle": 254
        }
      }
    ]
  }
}
production comes back in watts, not kW like the solar endpoint. For a farm-scale system, that means numbers in the millions. The first thing the code needs to do is convert that into something readable, megawatt-hours (MWh).
wind_10m describes wind conditions 10 metres above ground. Actual turbine output depends more on wind speed at hub height, which is why hub_height is a parameter you pass in, not just something read from the response.
One thing to get right: pass units=metric explicitly. Without it the API picks a unit system based on the location, so a farm in the UK returns wind speed in mph and a farm in Germany returns m/s. Fine until you start comparing sites.
One number worth calculating yourself: capacity factor, the percentage of a farm's rated capacity it actually achieves on average. A farm rated at 10 MW that produces 18 MWh over 13 hours is running at roughly 14% capacity for that window, nowhere near its rated maximum. Wind farms typically run 25 to 45% capacity factor over a full year; anything you calculate for a short window will swing a lot more than that.
Calculate it against the number of hours you actually received, not a hardcoded 24. If the API returns a partial day, dividing by 24 quietly halves your answer.
Step 2: Build the app
Create a file called app.py:
import streamlit as st
import pandas as pd
import requests
from datetime import date

API_KEY = "YOUR-API-KEY"
BASE_URL = "https://www.meteosource.com/api/v1/renewables/wind_prediction"

st.set_page_config(page_title="Wind Forecast Dashboard", layout="centered")
st.title("Wind Generation Forecast")

col1, col2 = st.columns(2)
with col1:
    lat = st.number_input("Latitude", value=51.5, format="%.4f")
    total_capacity = st.number_input("Total capacity (MW)", value=10.0, min_value=0.1)
with col2:
    lon = st.number_input("Longitude", value=0.0, format="%.4f")
    turbine_count = st.number_input("Number of turbines", value=4, min_value=1, step=1)

hub_height = st.slider("Hub height (m)", min_value=50, max_value=150, value=90)
forecast_date = st.date_input("Forecast date", value=date.today())

if st.button("Get forecast"):
    params = {
        "lat": lat,
        "lon": lon,
        "date": f"{forecast_date}T00:00:00",
        "total_capacity": total_capacity,
        "turbine_count": turbine_count,
        "hub_height": hub_height,
        "units": "metric",
        "key": API_KEY,
    }

    response = requests.get(BASE_URL, params=params, timeout=10)

    if response.status_code != 200:
        st.error(f"API request failed: {response.status_code}")
        st.stop()

    data = response.json().get("hourly", {}).get("data", [])

    if not data:
        st.warning("No data. Try a date within the next five days.")
        st.stop()

    df = pd.DataFrame(data)
    df["date"] = pd.to_datetime(df["date"])
    df["wind_speed"] = df["wind_10m"].apply(
        lambda w: w.get("speed") if isinstance(w, dict) else None
    )
    df = df.set_index("date")
    df["production_mwh"] = df["production"] / 1_000_000

    hours = len(df)
    total_mwh = df["production_mwh"].sum()
    capacity_factor = (total_mwh / (total_capacity * hours)) * 100

    m1, m2 = st.columns(2)
    m1.metric(f"Estimated generation ({hours}h)", f"{total_mwh:.1f} MWh")
    m2.metric("Capacity factor", f"{capacity_factor:.0f}%")

    st.line_chart(df["production_mwh"])

    with st.expander("See raw hourly data"):
        st.dataframe(df[["production_mwh", "wind_speed"]])
Replace YOUR-API-KEY with your actual key from your Meteosource dashboard. If you push this to a public repo, move the key into an environment variable or st.secrets first. You can also send the key as an X-API-Key header instead of a query parameter, which keeps it out of request logs.
Step 3: Run it
streamlit run app.py
Enter a location, your farm's capacity, turbine count, and hub height, pick a date, and hit "Get forecast."
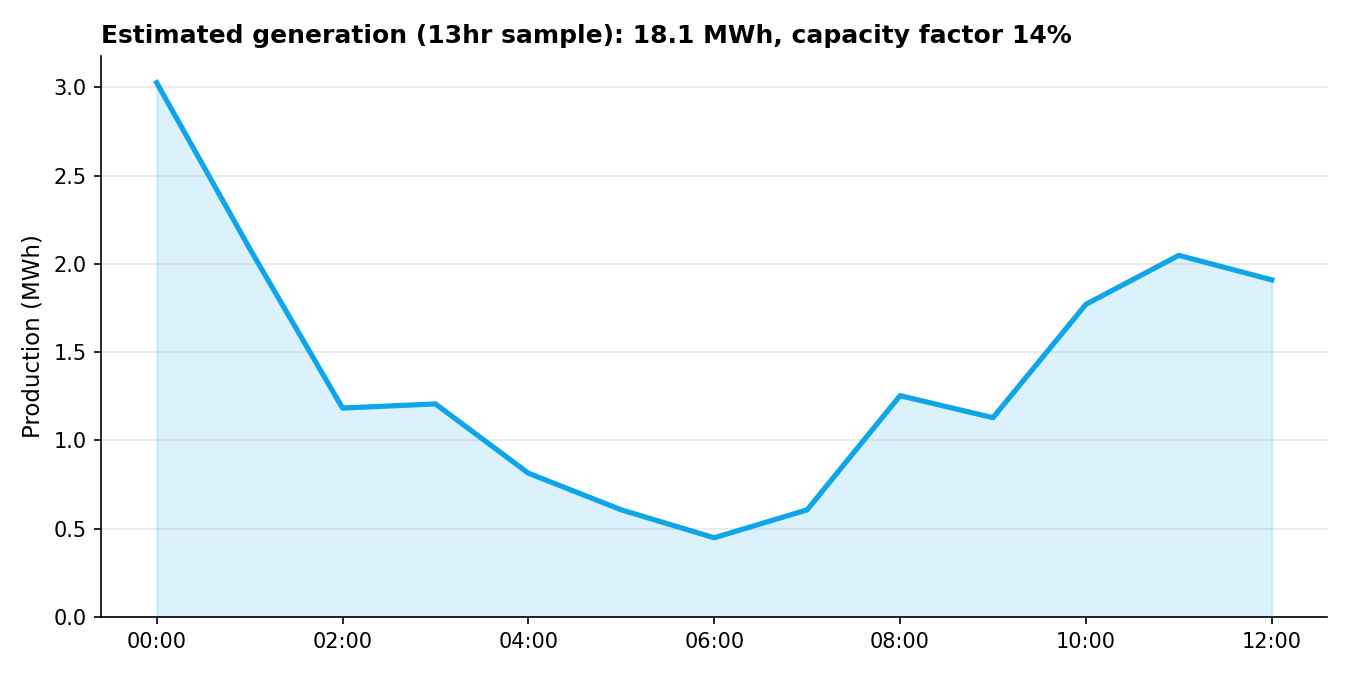
Example built from the sample response in Meteosource's documentation, a 13 hour window scored against an assumed 10 MW rated capacity. Notice the shape: no clean curve, output tracks wind speed directly, which is why wind forecasting is a harder problem than solar.
What this is doing, in plain terms
requestscalls the API with your farm's real specs and gets back raw hourly dataThe production values arrive in watts; dividing by 1,000,000 turns them into MWh, a scale that means something to a human reading the dashboard
pandasunpacks the nestedwind_10mobject into a flat column so it's easy to chartThe capacity factor is scored against the hours actually returned, so a partial day still gives an honest number
streamlitrenders the total, the capacity factor, and a chart, with very little code
Where to go from here
A few natural next steps once the basic version works:
Pass a real turbine model. The endpoint also accepts
turbine_model, which changes the underlying power curve used for the calculation. Two turbines with identical capacity can produce meaningfully different output at the same wind speed.Add solar to the same dashboard. The
/solar_predictionendpoint returns a similar hourly structure, so a combined view is useful for any site running both. There's a full walkthrough of the solar version if you want to build that side first. Note the magnitudes are very different, so normalise the two series or use a second axis.Chart wind speed alongside production. Plotting
wind_speednext toproduction_mwhmakes it visually obvious where the farm's cut-in and rated speeds are.Cache the API call. Wrap the request in
@st.cache_dataso refreshing the page doesn't burn another API call for the same inputs.Switch to 15-minute resolution. The same parameters work against
/api/v1/renewables/15min/wind_prediction, which matters if you're bidding into an intraday market rather than planning a day ahead.
If you're forecasting more than one site, the Renewables tier is priced per location, and covers wind and solar prediction together.